Exploring the Contact Center Agent Client

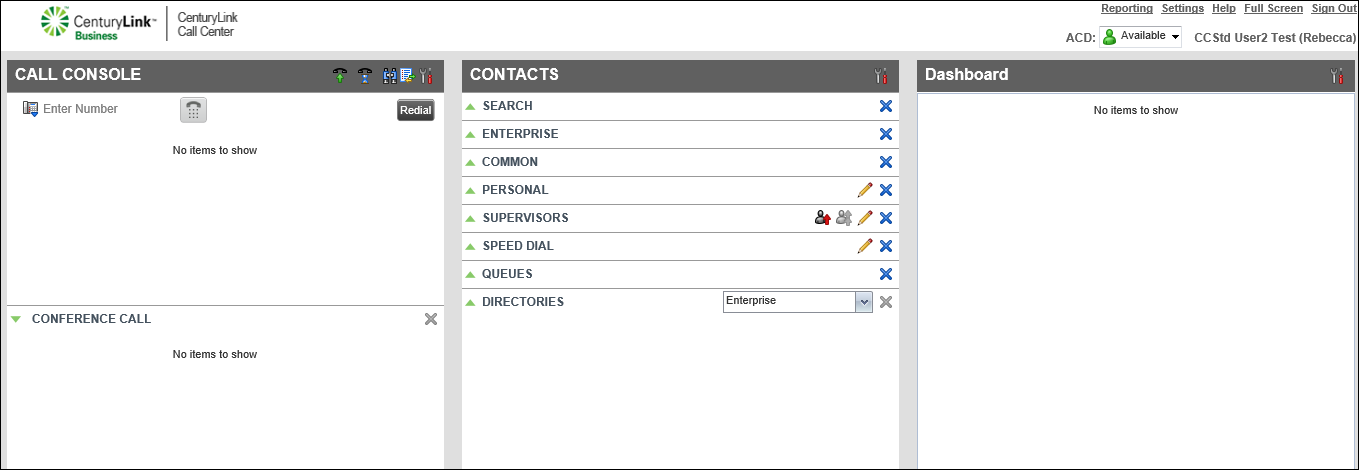
After you sign in to the Contact Center Agent Client, the main page displays, which is where you’ll do most of your call managing and monitoring activities. The main page also provides links to additional pages and windows where you access other features and functions such as saving your workspace and configuring and running reports.
Note: Are you a supervisor? Learn more about the Contact Center Supervisor Client.
The main page has three sections and a menu:

The Call Console pane is where you answer and make calls, transfer callers, start conference calls, and access call history. Your client isn’t a softphone, so you’ll need to use your desk phone’s handset, speakerphone, or headset to speak with a contact.
The Call Console pane shows you current call information for both direct and ACD calls. Direct calls are placed from or received on your own phone number. ACD calls are routed to you from a queue as an agent. If you’re on a conference call, details are displayed at the bottom of the Call Console pane in the Conference Call panel.aa
On the Call Console pane header bar, be sure to turn off the Auto Answer feature so that calls are only answered when you’re at your desk and available. Click the Call History button (the list icon) to show all missed, received, and placed calls. We recommend turning on Call Waiting (a handset with a blue timer icon) to answer a second call while on an active call, which puts the first caller on hold while you answer the second call.

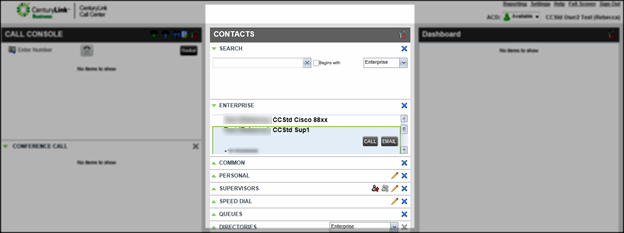
The Contacts pane contains your directories (enterprise, queues, personal, speed dial, and agents). From the Contacts pane you can look for a contact, call a contact, and edit a contact record in your personal and speed dial directory. If you need to call a contact, but don’t know the contact’s phone number, use the search feature. In your personal and speed dial directories you can add or delete contacts and manage your speed dial numbers. If you want to see some or all the queues assigned to you, in your queues directory, select what queues show in the directory. To see a list of your supervisors, use the supervisor directory where you can also quickly call a supervisor about an escalating situation or an emergency.
On the Contacts pane header bar, click the Options button (the tools icon) to select the directories you want to display in the Contacts pane. You can also manage how names display by first or last name in the enterprise directory using the sort feature.

The Dashboard pane lists the monitored queues and important realtime data such as current calls in queue, longest waiting call, expected waiting time (EWT), average speed of answer (ASA), and average handle time (AHT). The data is color coded to show if the queues are at normal or above normal levels (severity thresholds). The severity thresholds and color-coded visual indicators are managed by your organization’s administrator.
Click the Options button (the wrench and screwdriver icon) to customize the queues to view, the order that they display, and select the performance statistics you want to monitor.

On the top right menu of the main page in the Contact Center Agent Client, you can access reports, set features and application functions, turn on or off full screen mode, and sign in and sign out of Contact Center.
The reports page opens in a separate window and can be opened at the same time the Contact Center Agent Client window is open.
Explore VoIP solutions
Add-on VoIP features
Contact Center Client
Top content
- Viewing and using your call history
- Signing in to the Contact Center Client
- Accessing the Contact Center Client for the first time
- Calling a supervisor for an escalating problem
- Conference calling from the Contact Center Client
- Adding a contact to your Speed Dial directory
- Exploring the Contact Center Agent Client
- Setting up the Contact Center Client the first time you sign in
- Answering calls automatically
- Exploring the Contact Center Supervisor Client dashboard statistics


